Figures from DoG Picker paper
Figures from DoG Picker paper
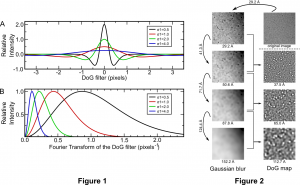
Figure 1 [left image]: Shape of the DoG function. (A) Real space shape of the DoG functions for difference sigma values (B) The Fourier transform of the same DoG functions shown in panel A. Note how the DoG filter acts as a band-pass filter.
Figure 2 [right image]: Example of the DoG picker technique for picking particles of different sizes. The original image of GroEL particles (upper right) is first blurred by a sigma of 29.2A (upper left). Next the image is successively blurred three more times by the values at the far left to get final images blurred by the amount below the image (left column). Each successive image pair is then subtracted to get the DoG filtered map (right column) highlighting the particles of a different size for each DoG map. This example then picks particles of size 37.5A, 65.0A, and 112.7A.
Paper information:
N.R. Voss, C.K. Yoshioka, M. Radermacher, C.S. Potter and B. Carragher
“DoG Picker and TiltPicker: software tools to facilitate particle selection in single particle electron microscopy.”
DOI: 10.1016/j.jsb.2009.01.004
Neil Voss and Craig Yoshioka – Scripps Research Institute


